
| Strain Name |
C57BL/6N-Siglec15tm1(SIGLEC15)Bcgen/Bcgen |
Common Name | B-hSIGLEC15 mice |
| Background | C57BL/6N | Catalog number | 110121 |
|
Related Genes |
SIGLEC15 (sialic acid binding Ig like lectin 15) | ||
mRNA expression analysis
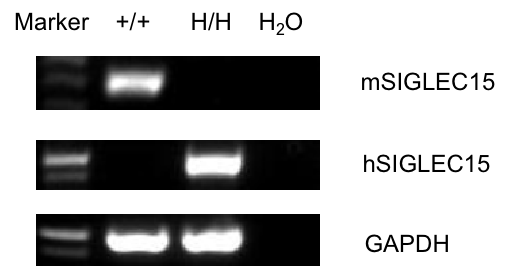
Strain specific analysis of SIGLEC15 gene expression in WT and B-hSIGLEC15 mice by RT-PCR. Mouse Siglec15 mRNA was detectable in splenocytes of wild-type (+/+) mice. Human SIGLEC15 mRNA was detectable only in H/H, but not in +/+ mice.
Protein expression analysis in macrophages
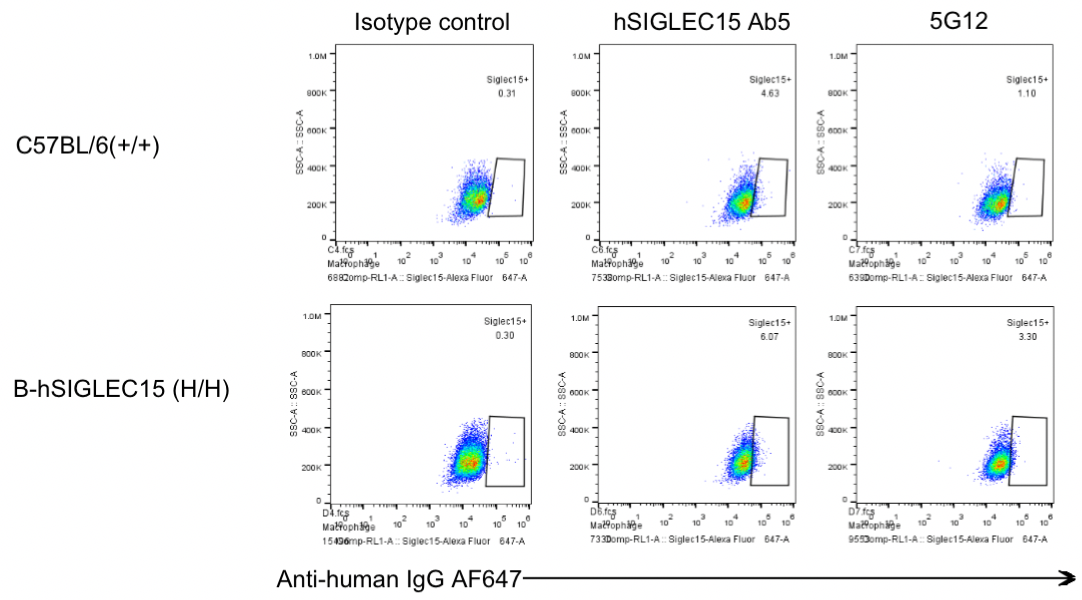
Strain specific SIGLEC15 expression analysis in homozygous B-hSIGLEC15 mice by flow cytometry. Peritoneal lavage fluids were collected from WT and homozygous B-hSIGLEC15 (H/H) mice, and analyzed by flow cytometry with anti-SIGLEC15 antibody (hSIGLEC15 Ab5 and 5G12 were made in house, and both cross-react with human and mouse SIGLEC15). Mouse SIGLEC15 was detectable in WT mice. Human SIGLEC15 was detectable in homozygous B-hSIGLEC15 mice.
Protein expression analysis in bone marrow-derived macrophages (BMDMs)
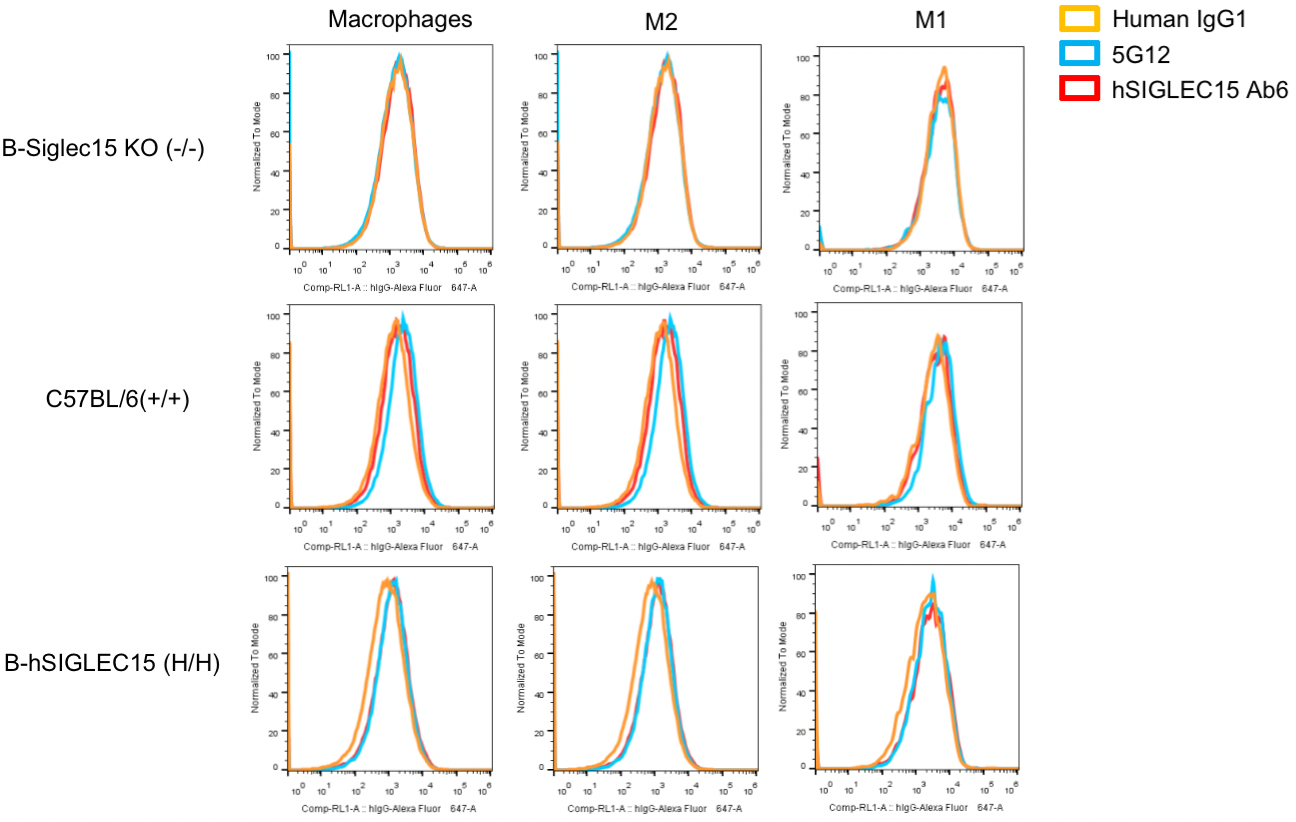
Strain specific SIGLEC15 expression analysis in homozygous B-hSIGLEC15 mice by flow cytometry. Bone marrow were collected from WT, homozygous B-hSIGLEC15 KO (H/H) and B-hSIGLEC15 (H/H) mice, stimulated with 10 ng/mL M-CSF and cultured for 9 days and analyzed by flow cytometry with anti-SIGLEC15 antibody (SIGLEC15 Ab6 and 5G12 antibody were made in house, and 5G12 cross-reacts with human and mouse SIGLEC15 while Ab6 specifically recognizes human SIGLEC15). Mouse SIGLEC15 was detectable in WT mice but not the B-Siglec15 KO mice(-/-). Human SIGLEC15 was detectable in bone marrow-derived macrophages (BMDMs) especially the M2 macrophages of homozygous B-hSIGLEC15 mice.
Antibody binding assay
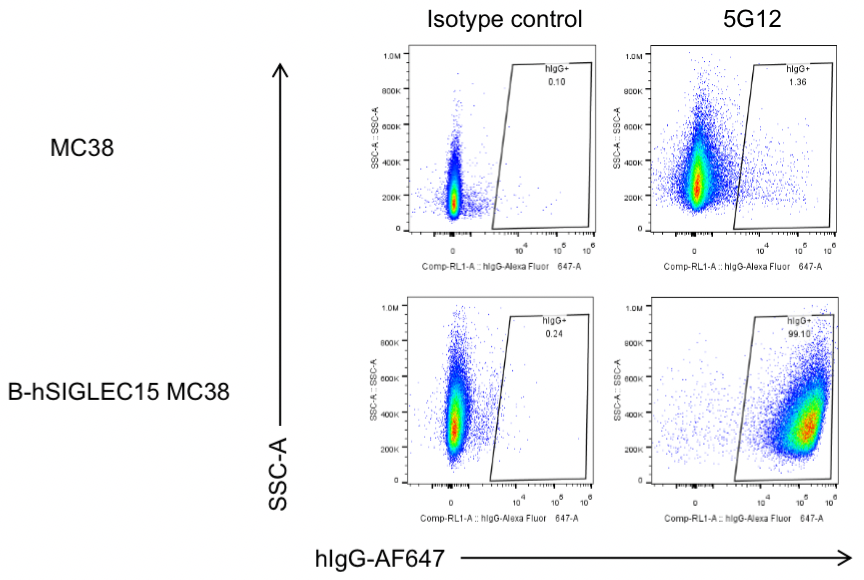
Analysis of B-hSIGLEC15 MC38 by FACS. Flow cytometry analysis of the B-hSIGLEC15 MC38 was performed to assess anti-human SIGLEC15 antibody. Single live cells were gated and used for further analysis as indicated here. Human SIGLEC15 expression was detectable on B-hSIGLEC15 MC38 as evidenced by 5G12 (in house) binding vs isotype control.
Analysis of spleen leukocyte subpopulations in B-hSIGLEC15 mice
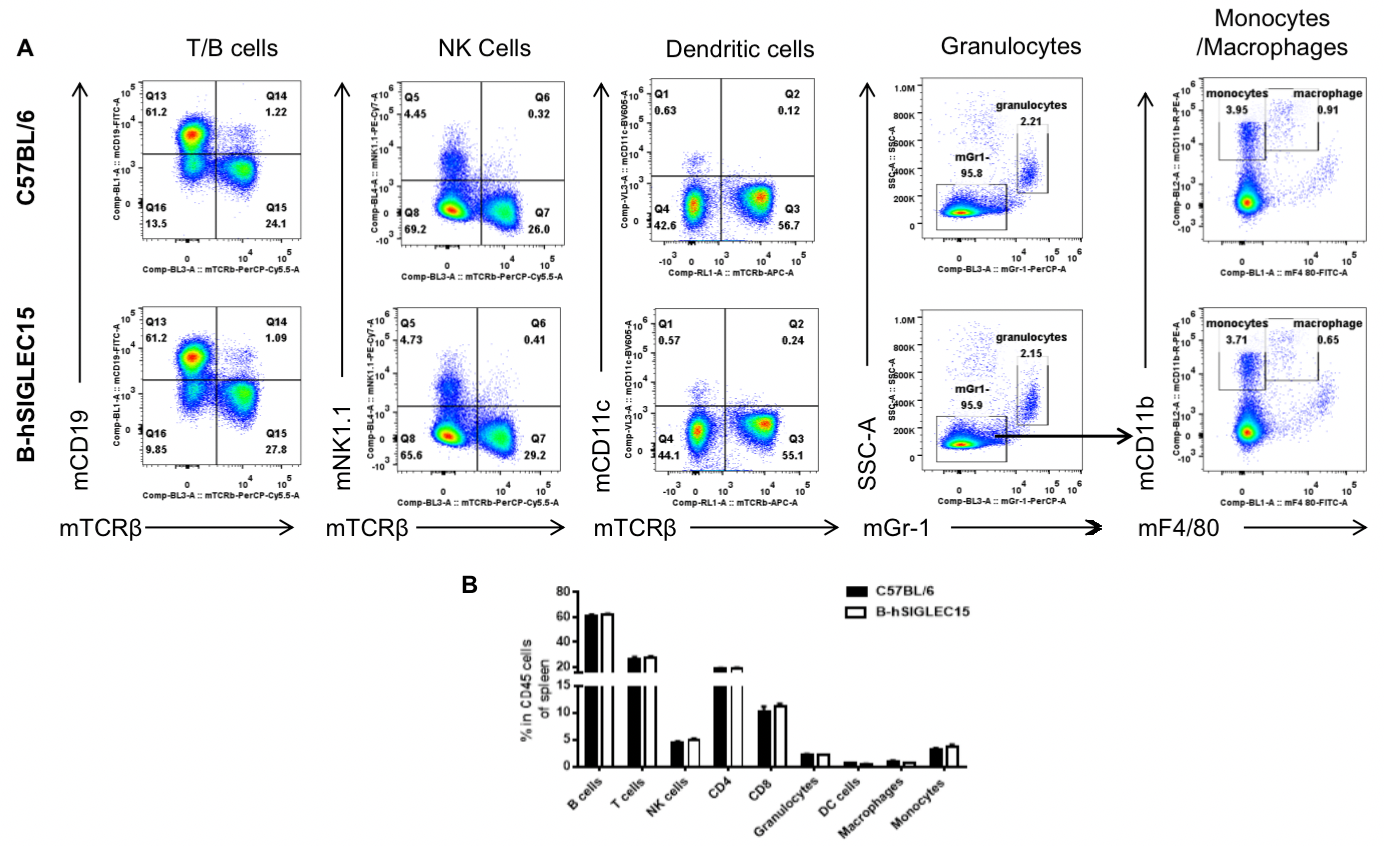
Analysis of splenic leukocyte subpopulations by FACS
Splenocytes were isolated from female C57BL/6 and B-hSIGLEC15 mice (n=3, 6 weeks-old) and analyzed by flow cytometry to assess leukocyte subpopulations. (A) Representative FACS plots gated on single live CD45+ cells for further analysis. (B) Results of FACS analysis. Percentages of T, B, NK cells, monocytes/macrophages, and DC were similar in homozygous B-hSIGLEC15 mice and C57BL/6 mice, demonstrating that introduction of hSIGLEC15 in place of its mouse counterpart does not change the overall development, differentiation, or distribution of these cell types in spleen. Values are expressed as mean ± SEM.
Analysis of spleen leukocyte subpopulations in B-hSIGLEC15 mice
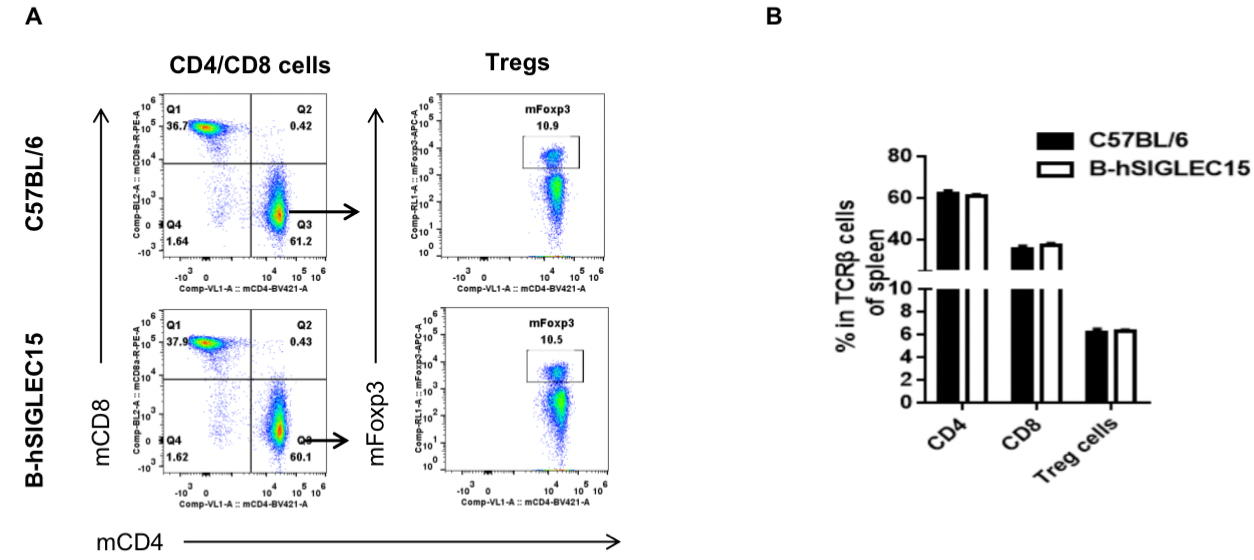
Analysis of splenic T cell subpopulations by FACS
Splenocytes were isolated from female C57BL/6 and B-hSIGLEC15 mice (n=3, 6 weeks-old) and analyzed by flow cytometry for T cell subsets. (A) Representative FACS plots gated on TCRβ+ T cells and further analyzed. (B) Results of FACS analysis. Percentages of CD8+, CD4+, and Treg cells were similar in homozygous B-hSIGLEC15 and C57BL/6 mice, demonstrating that introduction of hSIGLEC15 in place of its mouse counterpart does not change the overall development, differentiation or distribution of these T cell subtypes in spleen. Values are expressed as mean ± SEM.
Analysis of lymph node leukocyte subpopulations in B-hSIGLEC15 mice

Analysis of lymph node leukocyte subpopulations by FACS
Lymph node were isolated from female C57BL/6 and B-hSIGLEC15 mice (n=3, 6 weeks-old) and analyzed by flow cytometry to assess leukocyte subpopulations. (A) Representative FACS plots gated on single live CD45+ cells for further analysis. (B) Results of FACS analysis. Percentages of T, B, NK cells, monocytes/macrophages, and DC were similar in homozygous B-hSIGLEC15 mice and C57BL/6 mice, demonstrating that introduction of hSIGLEC15 in place of its mouse counterpart does not change the overall development, differentiation, or distribution of these cell types in lymph node. Values are expressed as mean ± SEM.
Analysis of lymph node leukocyte subpopulations in B-hSIGLEC15 mice
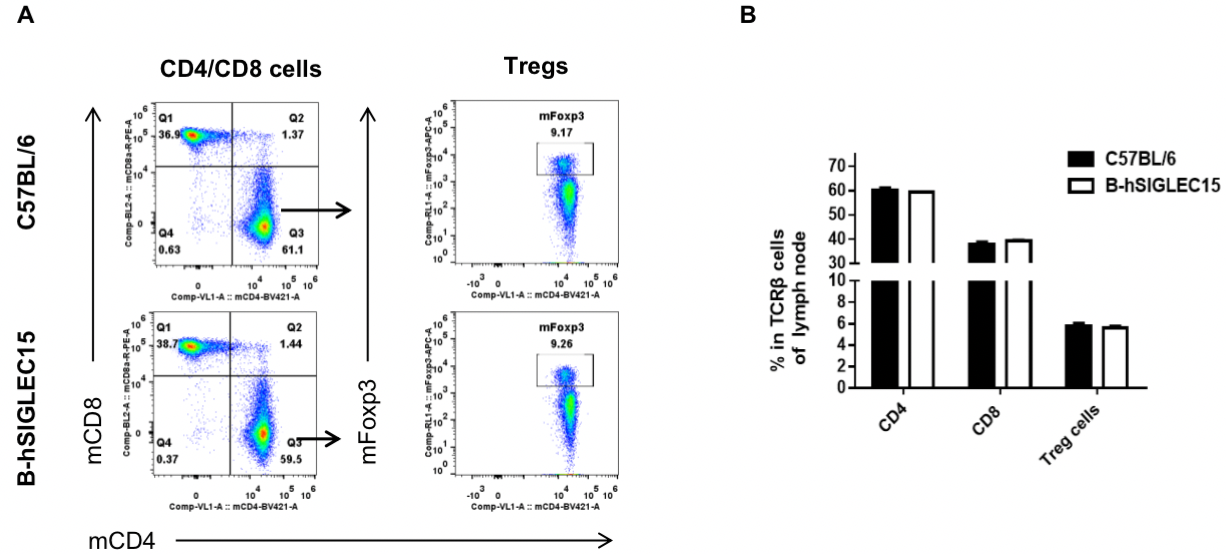
Analysis of lymph node T cell subpopulations by FACS
Lymph node were isolated from female C57BL/6 and B-hSIGLEC15 mice (n=3, 6 weeks-old) and analyzed by flow cytometry for T cell subsets. (A) Representative FACS plots gated on TCRβ+ T cells and further analyzed. (B) Results of FACS analysis. Percentages of CD8+, CD4+, and Treg cells were similar in homozygous B-hSIGLEC15 and C57BL/6 mice, demonstrating that introduction of hSIGLEC15 in place of its mouse counterpart does not change the overall development, differentiation or distribution of these T cell subtypes in lymph node. Values are expressed as mean ± SEM.
Analysis of blood leukocyte subpopulations in B-hSIGLEC15 mice
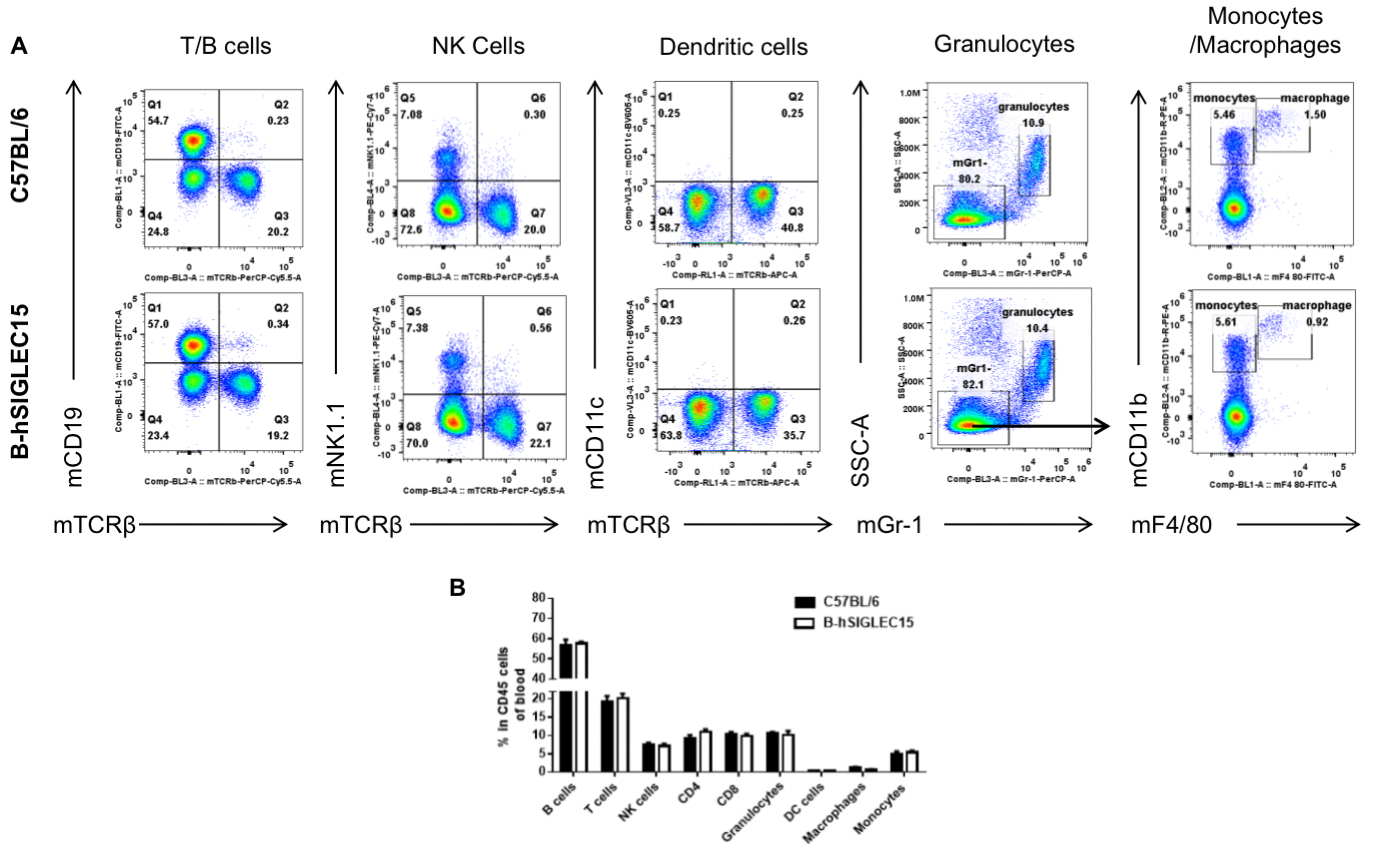
Analysis of blood leukocyte subpopulations by FACS
Blood were isolated from female C57BL/6 and B-hSIGLEC15 mice (n=3, 6 weeks-old) and analyzed by flow cytometry to assess leukocyte subpopulations. (A) Representative FACS plots gated on single live CD45+ cells for further analysis. (B) Results of FACS analysis. Percentages of T, B, NK cells, monocytes/macrophages, and DC were similar in homozygous B-hSIGLEC15 mice and C57BL/6 mice, demonstrating that introduction of hSIGLEC15 in place of its mouse counterpart does not change the overall development, differentiation, or distribution of these cell types in blood. Values are expressed as mean ± SEM.
Analysis of blood leukocyte subpopulations in B-hSIGLEC15 mice
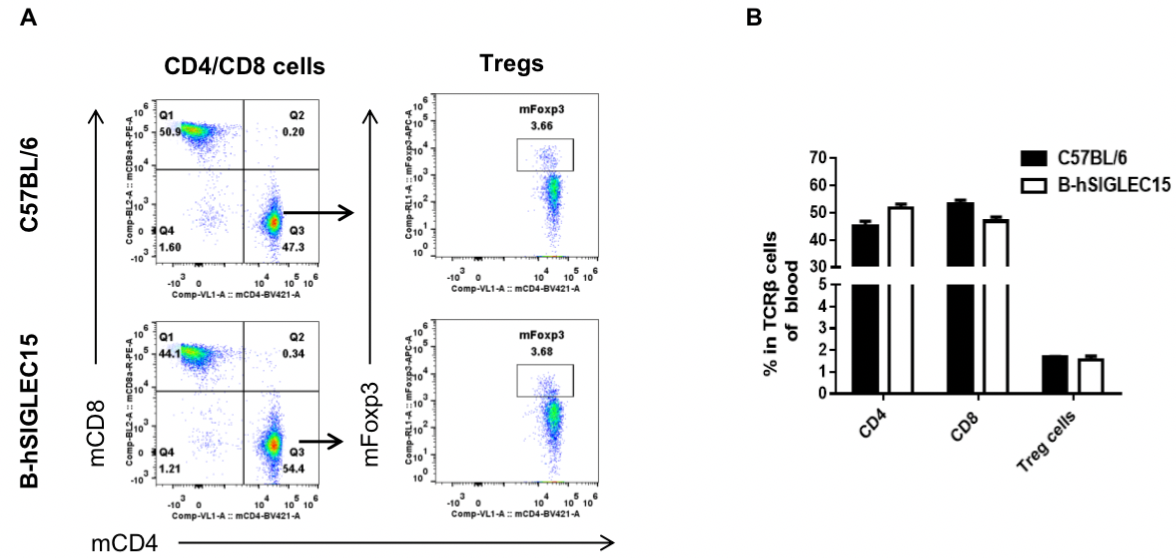
Analysis of blood T cell subpopulations by FACS
Blood were isolated from female C57BL/6 and B-hSIGLEC15 mice (n=3, 6 weeks-old) and analyzed by flow cytometry for T cell subsets. (A) Representative FACS plots gated on TCRβ+ T cells and further analyzed. (B) Results of FACS analysis. Percentages of CD8+, CD4+, and Treg cells were similar in homozygous B-hSIGLEC15 and C57BL/6 mice, demonstrating that introduction of hSIGLEC15 in place of its mouse counterpart does not change the overall development, differentiation or distribution of these T cell subtypes in blood. Values are expressed as mean ± SEM.
In vivo efficacy of anti-human SIGLEC15 antibody
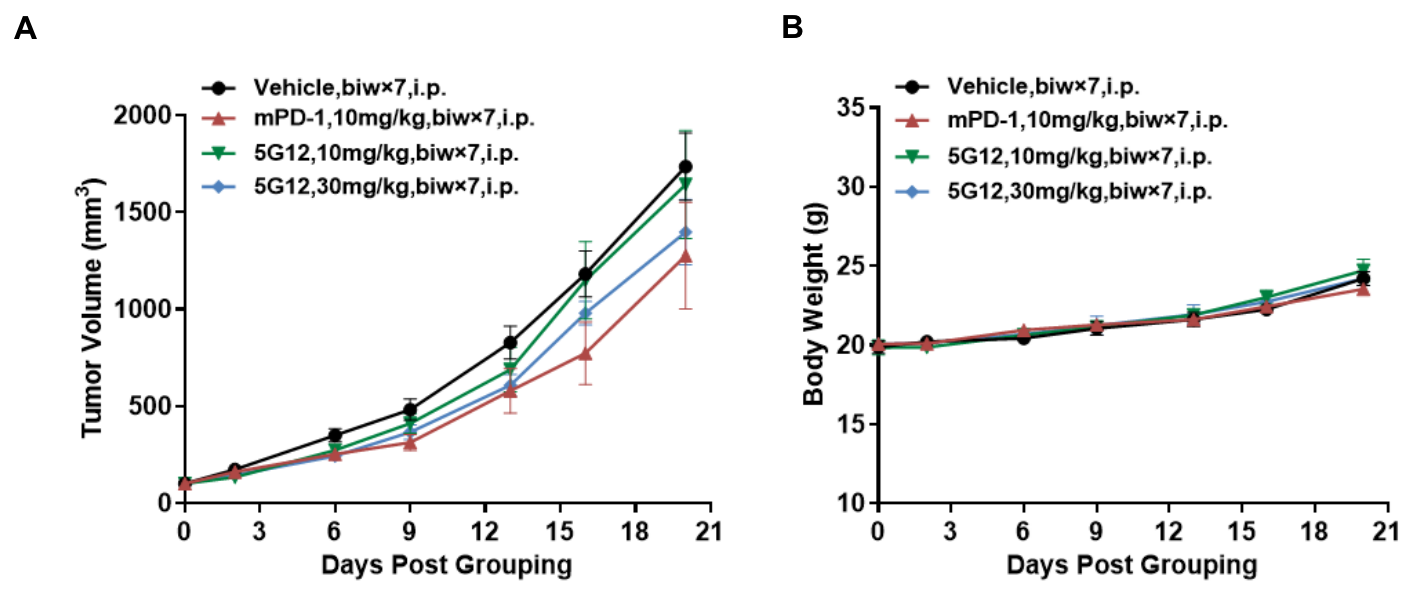
Antitumor activity of anti-human SIGLEC15 antibody in B-hSIGLEC15 mice. (A) Anti-human SIGLEC15 antibody inhibited hSIGLEC15-MC38 tumor growth in B-hSIGLEC15 mice. Murine colon cancer hSIGLEC15-MC38 cells (5E5) were subcutaneously implanted into B-hSIGLEC15 mice (female, 7-8 week-old, n=5). Mice were grouped when tumor volume reached approximately 100 mm3, at which time they were treated with anti-human SIGLEC15 antibody with doses and schedules indicated in panel A. (B) Body weight changes during treatment. As shown in panel A, anti-human SIGLEC15 antibody 5G12 (in house) was efficacious in controlling tumor growth in a dose-dependent manner in B-hSIGLEC15 mice. Values are expressed as mean ± SEM.
In vivo efficacy of anti-human SIGLEC15 antibody

Antitumor activity of anti-human SIGLEC15 antibodies in B-hSIGLEC15 mice. (A) Anti-human SIGLEC15 antibodies inhibited hSIGLEC15-MC38 tumor growth in B-hSIGLEC15 mice. Murine colon cancer hSIGLEC15-MC38 cells (5E5) were subcutaneously implanted into B-hSIGLEC15 mice (female, 7-8 week-old, n=5). Mice were grouped when tumor volume reached approximately 100 mm3, at which time they were treated with anti-human SIGLEC15 antibodies with doses and schedules indicated in panel A. (B) Body weight changes during treatment. As shown in panel A, anti-human SIGLEC15 antibodies was efficacious in controlling tumor growth in B-hSIGLEC15 mice. Values are expressed as mean ± SEM. (All antibodies were provided by the clients)