
| Strain Name |
C57BL/6-Hctm1(C5)Bcgen C5ar1tm1(C5AR1)Bcgen/Bcgen
|
Common Name | B-hC5/hC5AR1 mice |
| Background | C57BL/6 | Catalog number | 121215 |
|
Related Genes |
C5: C5Da, C5b, CPAMD4, ECLZB; C5AR1: C5A; C5AR; C5R1; CD88 | ||
mRNA expression analysis

Strain specific analysis of C5 and C5AR1 gene expression in wild-type C57BL/6 mice and B-hC5/hC5AR1 mice by RT-PCR. Mouse Hc and C5ar1 mRNA were detectable only in lung cells of wild-type C57BL/6 mice (+/+). Human C5 and C5AR1 mRNA were detectable only in homozygous B-hC5/hC5AR1 mice (H/H), but not in wild-type mice.
Protein expression analysis
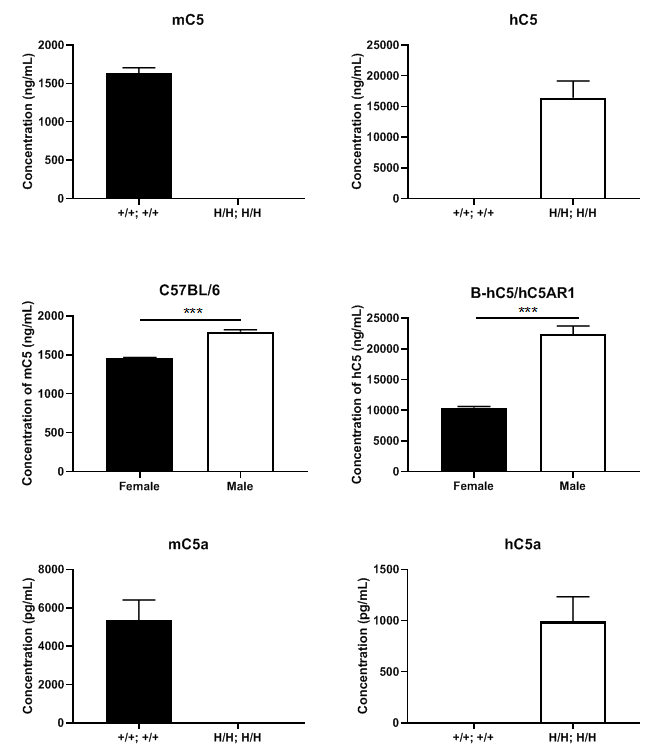
Strain specific C5 and C5a expression analysis in homozygous B-hC5/hC5AR1 mice by ELISA. Serum was collected from wild-type C57BL/6 mice (+/+; +/+) or homozygous B-hC5/hC5AR1 mice (H/H; H/H) and analyzed by ELISA with anti-C5 and anti-C5a antibodies. A. Mouse C5 and C5a were detectable in wild-type mice. Human C5 and C5a were exclusively detectable in homozygous B-hC5/hC5AR1 mice but not in wild-type mice. B. The concentration of C5 in male mice is higher than that in female mice.
Protein expression analysis
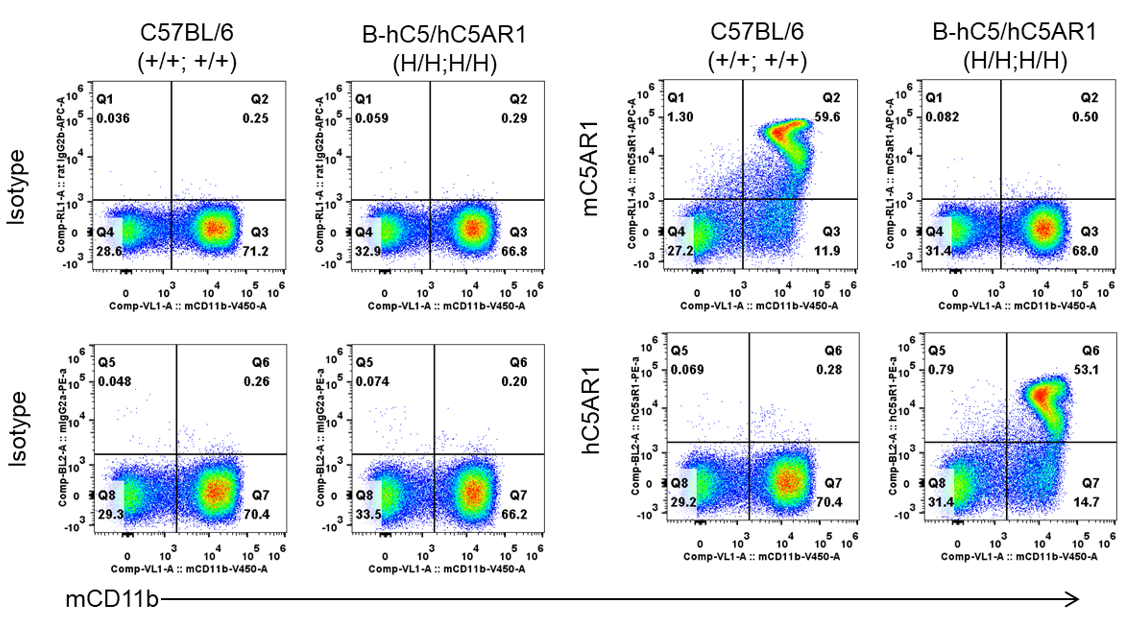
Strain specific C5AR1 expression analysis in homozygous B-hC5/hC5AR1 mice by FACS. Bone marrow was collected from wild-type C57BL/6 mice (+/+; +/+) and homozygous B-hC5/hC5AR1 mice (H/H; H/H), and analyzed by FACS with anti-C5AR1 antibody. Mouse C5AR1 was only detectable in wild-type mice. Human C5AR1 was exclusively detectable in homozygous B-hC5/hC5AR1 mice but not in wild-type mice.
Analysis of leukocytes cell subpopulation in spleen

Analysis of spleen leukocyte subpopulations by FACS. Splenocytes were isolated from female C57BL/6 and B-hC5/hC5AR1 mice (n=3, 6-week-old). Flow cytometry analysis of the splenocytes was performed to assess leukocyte subpopulations. A. Representative FACS plots. Single live cells were gated for the CD45+ population and used for further analysis as indicated here. B. Results of FACS analysis. Percent of T cells, B cells, NK cells, dendritic cells, granulocytes, monocytes and macrophages in homozygous B-hC5/hC5AR1 mice were similar to those in the C57BL/6 mice, demonstrating that introduction of hC5/hC5AR1 in place of its mouse counterpart does not change the overall development, differentiation or distribution of these cell types in spleen. Values are expressed as mean ± SEM.
Analysis of T cell subpopulation in spleen
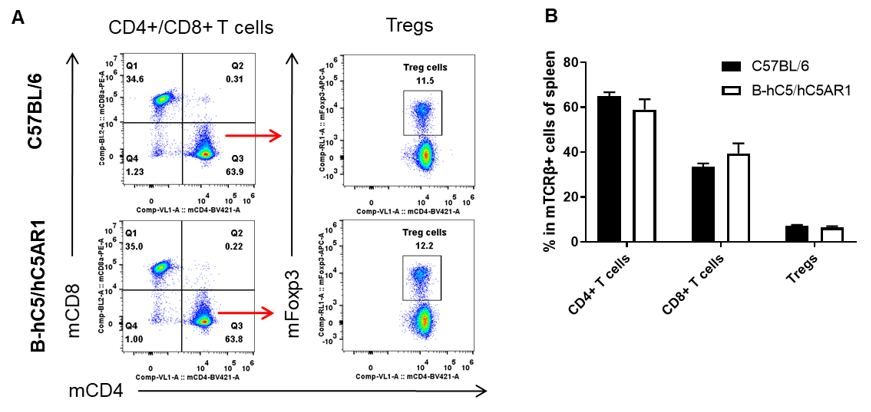
Analysis of spleen T cell subpopulations by FACS. Splenocytes were isolated from female C57BL/6 and B-hC5/hC5AR1 mice (n=3, 6-week-old). Flow cytometry analysis of the splenocytes was performed to assess leukocyte subpopulations. A. Representative FACS plots. Single live CD45+ cells were gated for TCRβ+ T cell population and used for further analysis as indicated here. B. Results of FACS analysis. The percent of CD4+ T cells, CD8+ T cells and Tregs in homozygous B-hC5/hC5AR1 mice were similar to those in the C57BL/6 mice, demonstrating that introduction of hC5/hC5AR1 in place of its mouse counterpart does not change the overall development, differentiation or distribution of these T cell subtypes in spleen. Values are expressed as mean ± SEM.
Analysis of leukocytes cell subpopulation in lymph node
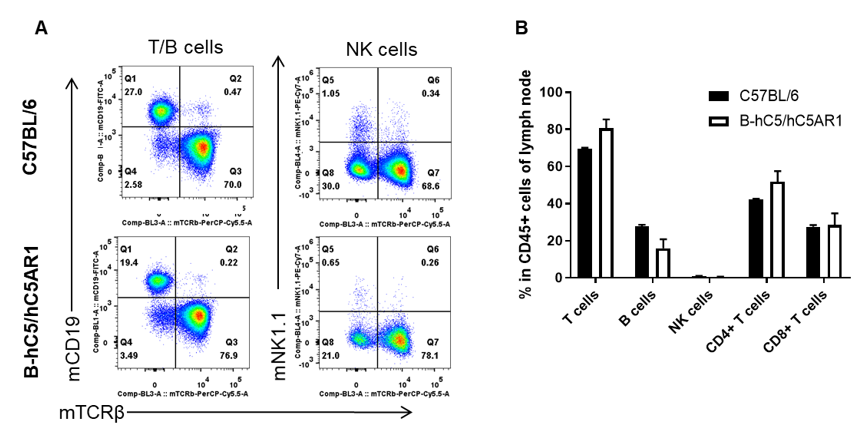
Analysis of lymph node leukocyte subpopulations by FACS. Lymph nodes were isolated from female C57BL/6 and B-hC5/hC5AR1 mice (n=3, 6-week-old). Flow cytometry analysis of the leukocytes was performed to assess leukocyte subpopulations. A. Representative FACS plots. Single live cells were gated for the CD45+ population and used for further analysis as indicated here. B. Results of FACS analysis. Percent of T cells, B cells, NK cells, dendritic cells, granulocytes, monocytes and macrophages in homozygous B-hC5/hC5AR1 mice were similar to those in the C57BL/6 mice, demonstrating that introduction of hC5/hC5AR1 in place of its mouse counterpart does not change the overall development, differentiation or distribution of these cell types in lymph node. Values are expressed as mean ± SEM.
Analysis of T cell subpopulation in lymph node

Analysis of lymph node T cell subpopulations by FACS. Leukocytes were isolated from female C57BL/6 and B-hC5/hC5AR1 mice (n=3, 6-week-old). Flow cytometry analysis of the leukocytes was performed to assess leukocyte subpopulations. A. Representative FACS plots. Single live CD45+ cells were gated for TCRβ+ T cell population and used for further analysis as indicated here. B. Results of FACS analysis. The percent of CD4+ T cells, CD8+ T cells, and Tregs in homozygous B-hC5/hC5AR1 mice were similar to those in the C57BL/6 mice, demonstrating that introduction of hC5/hC5AR1 in place of its mouse counterpart does not change the overall development, differentiation or distribution of these T cell subtypes in lymph node. Values are expressed as mean ± SEM.
Analysis of leukocytes cell subpopulation in blood
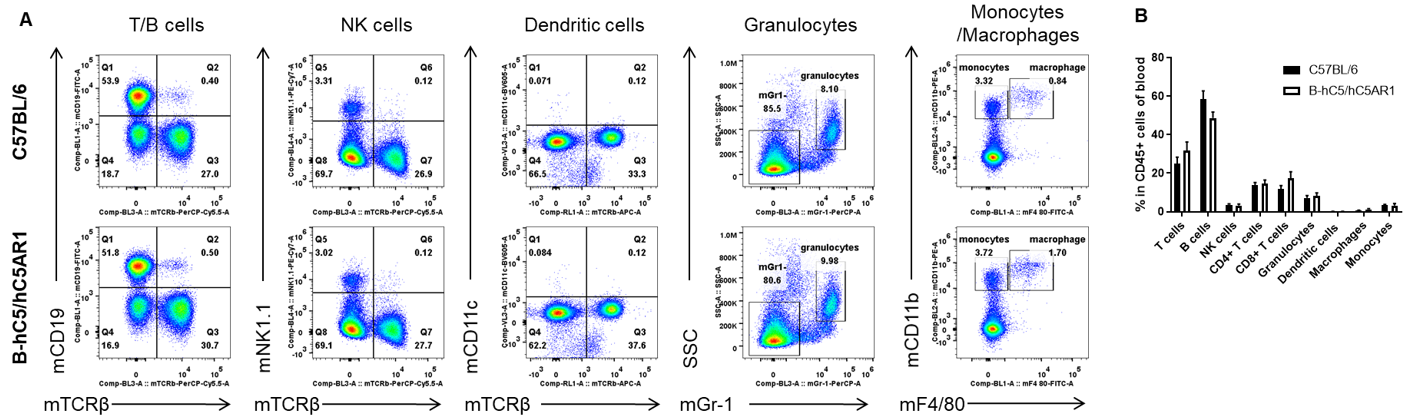
Analysis of blood leukocyte subpopulations by FACS. Blood cells were isolated from female C57BL/6 and B-hC5/hC5AR1 mice (n=3, 6-week-old). Flow cytometry analysis of the blood cells was performed to assess leukocyte subpopulations. A. Representative FACS plots. Single live cells were gated for the CD45+ population and used for further analysis as indicated here. B. Results of FACS analysis. Percent of T cells, B cells, NK cells, dendritic cells, granulocytes, monocytes and macrophages in homozygous B-hC5/hC5AR1 mice were similar to those in the C57BL/6 mice, demonstrating that introduction of hC5/hC5AR1 in place of its mouse counterpart does not change the overall development, differentiation or distribution of these cell types in blood. Values are expressed as mean ± SEM.
Analysis of T cell subpopulation in blood
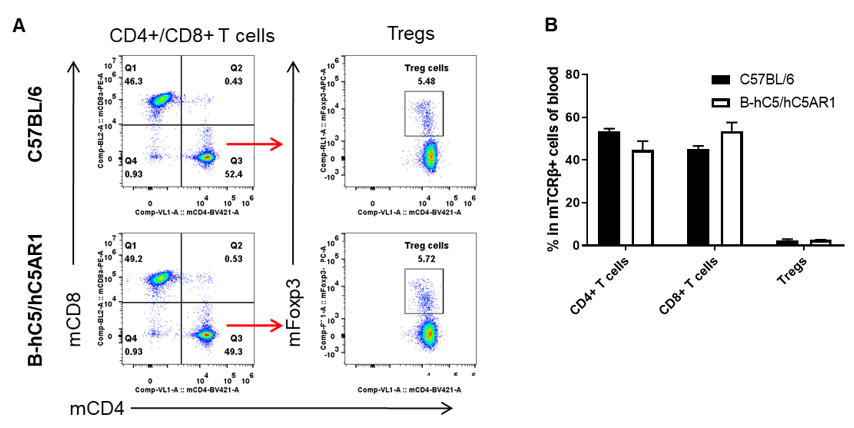
Analysis of blood T cell subpopulations by FACS. Blood cells were isolated from female C57BL/6 and B-hC5/hC5AR1 mice (n=3, 6-week-old). Flow cytometry analysis of the blood cells was performed to assess leukocyte subpopulations. A. Representative FACS plots. Single live CD45+ cells were gated for TCRβ+ T cell population and used for further analysis as indicated here. B. Results of FACS analysis. The percent of CD4+ T cells, CD8+ T cells, and Tregs in homozygous B-hC5/hC5AR1 mice were similar to those in the C57BL/6 mice, demonstrating that introduction of hC5/hC5AR1 in place of its mouse counterpart does not change the overall development, differentiation or distribution of these T cell subtypes in blood. Values are expressed as mean ± SEM.
Hemolytic activity of serum complement