B-hGPR75 mice
| Strain Name |
C57BL/6JNifdc-Gpr75tm1(GPR75)Bcgen/Bcgen
|
Common Name | B-hGPR75 mice |
| Background | C57BL/6JNifdc | Catalog number |
112305 |
|
Aliases |
GPRchr2, WI31133 | ||
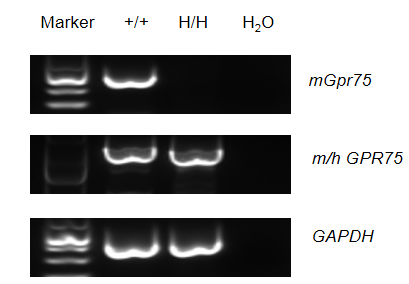
Strain specific analysis of GPR75 gene expression in wild-type C57BL/6 mice and B-hGPR75 mice by RT-PCR. Mouse GPR75 mRNA was detectable in brain of wild-type C57BL/6 mice, GPR75 mRNA was detectable in brain of wild-type C57BL/6 mice and homozygous B-hGPR75 mice (H/H) due to the high genetic similarity, and we sequenced and confirmed that the replaced region of homozygous B-hGPR75 mice (H/H) is the human GPR75 sequence.
mRNA expression analysis
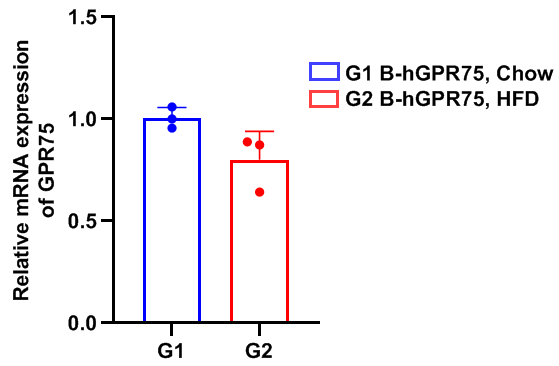
Strain specific analysis of GPR75 gene expression in B-hGPR75 mice by RT-qPCR. After high-fat diet (HFD) induction, the expression of GPR75 mRNA in brain tends to decrease compared to mice on a standard diet (Chow), but there is no significant difference.
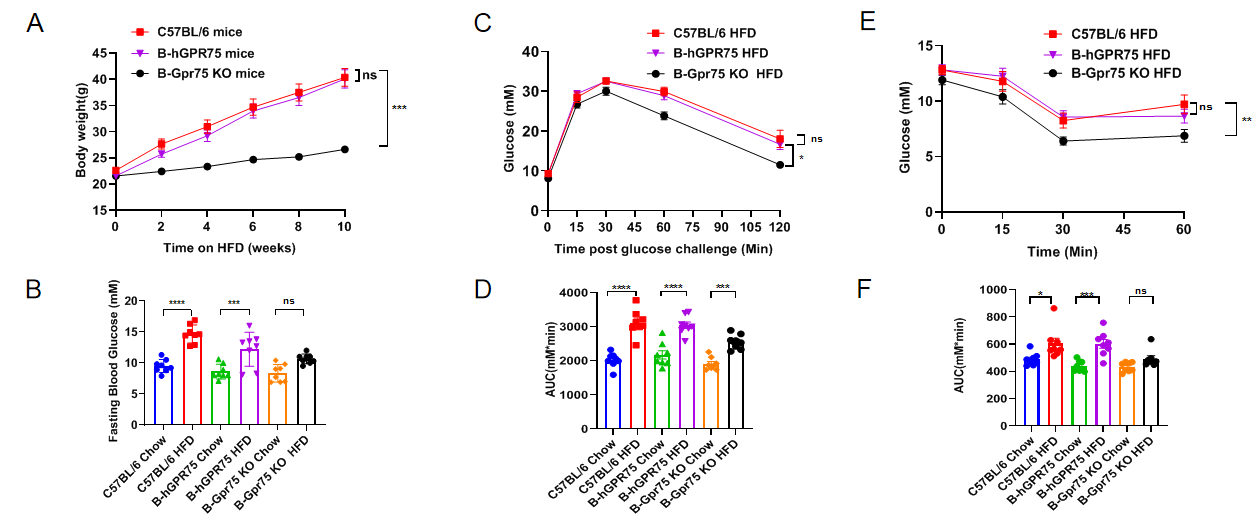
Weight gain during high-fat diet and metabolic phenotype in male B-hGPR75 mice. (A) Biweekly body weight gain during a 10-week high-fat diet (HFD) challenge. (B) Changes in fasting blood glucose after the high-fat diet challenge. (C) Results of a glucose tolerance test at the end of the 10-week high-fat diet challenge. (D) Area under the cueve (AUC) for the IPGTT. (E) Results of an insulin tolerance test at the end of the 10-week high-fat diet challenge. (F) Area under the curve (AUC) for the ITT. Results are presented as mean ±SEM. Abbreviations: ns, not statistically significant; *P < 0.05, **P < 0.01, ***P < 0.001, ****P < 0.0001.
There were no differences in weight gaining and metabolic phenotype between C57BL/6 mice and homozygous B-hGPR75 mice.
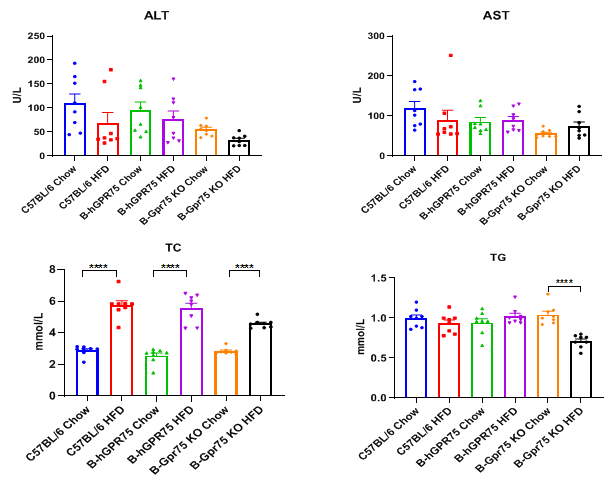
Blood biochemistry tests of B-hGPR75 mice. Serum from the male C57BL/6, homozygous B-hGPR75 mice and homozygous B-Gpr75 KO mice (n=8) was collected and analyzed for levels of ALT and AST. There were no significant differences in ALT and AST levels between groups. After a high-fat diet, the level of TC significantly increased, except for homozygous B-Gpr75 KO mice, the TG levels did not change much in other groups. Values are expressed as mean ± SEM. Abbreviations: ns, not statistically significant; *P < 0.05, **P < 0.01, ***P < 0.001, ****P < 0.0001.
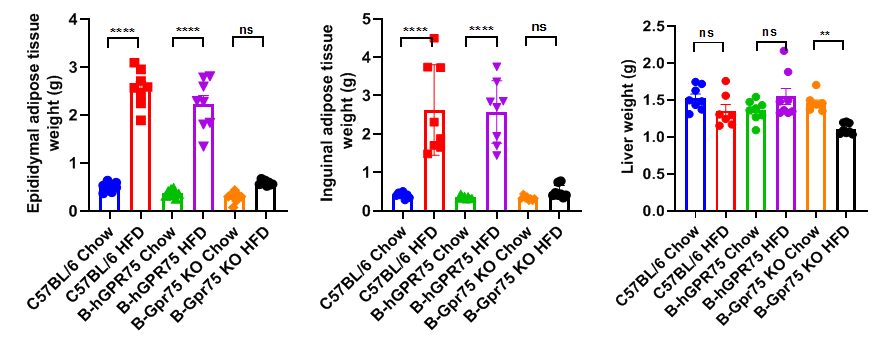
Body fat content and liver coefficient of high-fat diet in B-hGPR75 mice. After 10 weeks of high-fat induction in male C57BL/6, B-hGPR75 mice and B-Gpr75 KO mice (n=8), the epididymal adipose tissue, inguinal adipose tissue, and liver were weighed. The weight of fat in C57BL/6 and B-hGPR75 mice after high-fat induction was significantly higher than that in the Chow group. There was no significant difference in these indicators after high-fat induction in B-Gpr75 mice. Values are expressed as mean ± SEM. Abbreviations: ns, not statistically significant; *P < 0.05, **P < 0.01, ***P < 0.001, ****P < 0.0001.


