|
Strain Name
|
C57BL/6-Cxcr2tm1(CXCR2)Bcgen/Bcgen
|
Common Name
|
B-hCXCR2 mice
|
|
Background
|
C57BL/6
|
Catalog number
|
110816
|
Related Genes
|
C-X-C motif chemokine receptor 2, CD182, CDw128b, CMKAR2, IL8R2, IL8RA, IL8RB
|
Gene description
Chemokines are a group of small, mostly basic molecules that regulate cell trafficking of various leukocytes through interactions with a subset of 7-transmembrane G protein-coupled receptors. Chemokines mainly act on neutrophils, monocytes, lymphocytes, and eosinophils and play a pivotal role in host defense mechanisms. CXCR2 is a promiscuous receptor for several CXCL chemokines, including CXCL1, CXCL2, CXCL3, CXCL5, CXCL6, CXCL7, and CXCL8. It binds to IL8 with high affinity, and transduces the signal through a G-protein activated second messenger system. This receptor also binds to chemokine (C-X-C motif) ligand 1 (CXCL1/MGSA), a protein with melanoma growth stimulating activity, and has been shown to be a major component required for serum-dependent melanoma cell growth. This receptor mediates neutrophil migration to sites of inflammation. The angiogenic effects of IL8 in intestinal microvascular endothelial cells are found to be mediated by this receptor. Knockout studies in mice suggested that this receptor controls the positioning of oligodendrocyte precursors in developing spinal cord by arresting their migration.
mRNA expression analysis

Strain specific analysis of CXCR2 gene expression in WT and B-hCXCR2 mice by RT-PCR. Mouse Cxcr2 mRNA was detectable in splenocytes of wild-type (+/+) mice. Human CXCR2 mRNA was detectable only in H/H, but not in +/+ mice.
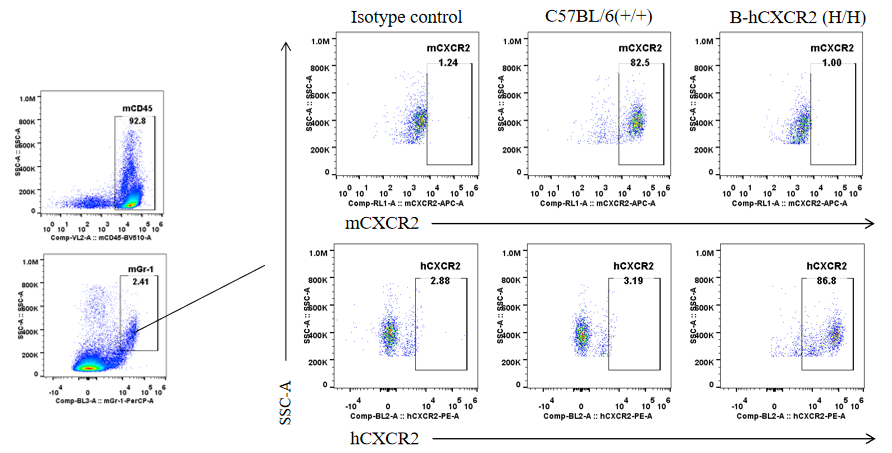
Protein expression analysis in Gr-1+ cells in spleen
Strain specific CXCR2 expression analysis in heterozygous B-hCXCR2 mice by flow cytometry. Splenocytes were collected from WT and heterozygous B-hCXCR2 (H/H) mice, and analyzed by flow cytometry with species-specific CXCR2 antibody. Mouse CXCR2 was detectable in WT mice and heterozygous B-hCXCR2. Human CXCR2 was exclusively detectable in heterozygous B-hCXCR2 but not WT mice.
Protein expression analysis in Gr-1+ cells in bone marrow
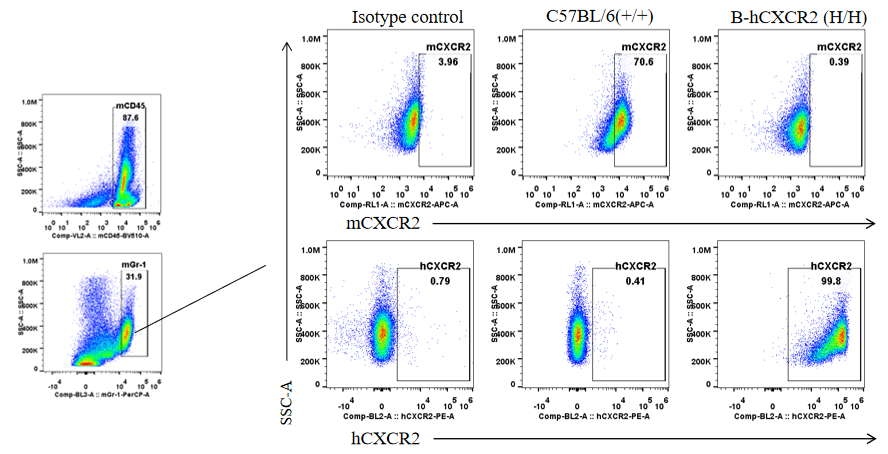
Strain specific CXCR2 expression analysis in homozygous B-hCXCR2 mice by flow cytometry. Splenocytes were collected from WT and homozygous B-hCXCR2 (H/H) mice, and analyzed by flow cytometry with species-specific CXCR2 antibody. Mouse CXCR2 was detectable in WT mice. Human CXCR2 was exclusively detectable in homozygous B-hCXCR2 but not WT mice.
Analysis of T cell subpopulation in spleen

Analysis of spleen leukocyte subpopulations by FACS. Splenocytes were isolated from female C57BL/6 and B-hCXCR2 mice (n=3, 7-week-old). Flow cytometry analysis of the splenocytes was performed to assess leukocyte subpopulations. A. Representative FACS plots. Single live cells were gated for the CD45+ population and used for further analysis as indicated here. B. Results of FACS analysis. Percent of T cells, B cells, NK cells, dendritic cells, granulocytes, monocytes and macrophages in homozygous B-hCXCR2 mice were similar to those in the C57BL/6 mice, demonstrating that CXCR2 humanized does not change the overall development, differentiation or distribution of these cell types in spleen. Values are expressed as mean ± SEM.
Analysis of T cell subpopulation in spleen

Analysis of spleen T cell subpopulations by FACS. Splenocytes were isolated from female C57BL/6 and B-hCXCR2 mice (n=3, 7-week-old). Flow cytometry analysis of the splenocytes was performed to assess leukocyte subpopulations. A. Representative FACS plots. Single live CD45+ cells were gated for TCRβ+ T cell population and used for further analysis as indicated here. B. Results of FACS analysis. The percent of CD4+ T cells, CD8+ T cells and Tregs in homozygous B-hCXCR2 mice were similar to those in the C57BL/6 mice, demonstrating that introduction of hCXCR2 in place of its mouse counterpart does not change the overall development, differentiation or distribution of these T cell subtypes in spleen. Values are expressed as mean ± SEM.
Analysis of leukocytes cell subpopulation in lymph node(LNs)

Analysis of LNs leukocyte subpopulations by FACS. LNs were isolated from female C57BL/6 and B-hCXCR2 mice (n=3, 7-week-old). Flow cytometry analysis of the LNs was performed to assess leukocyte subpopulations. A. Representative FACS plots. Single live cells were gated for the CD45+ population and used for further analysis as indicated here. B. Results of FACS analysis. Percent of T cells, B cells and NK cells in homozygous B-hCXCR2 mice were similar to those in the C57BL/6 mice, demonstrating that CXCR2 humanized does not change the overall development, differentiation or distribution of these cell types in LNs. Values are expressed as mean ± SEM.
Analysis of T cell subpopulation in lymph node(LNs)

Analysis of LNs T cell subpopulations by FACS. LNs were isolated from female C57BL/6 and B-hCXCR2 mice (n=3, 7-week-old). Flow cytometry analysis of the LNs was performed to assess leukocyte subpopulations. A. Representative FACS plots. Single live CD45+ cells were gated for TCRβ+ T cell population and used for further analysis as indicated here. B. Results of FACS analysis. The percent of CD4+ T cells, CD8+ T cells and Tregs in homozygous B-hCXCR2 mice were similar to those in the C57BL/6 mice, demonstrating that introduction of hCXCR2 in place of its mouse counterpart does not change the overall development, differentiation or distribution of these T cell subtypes in LNs. Values are expressed as mean ± SEM.
Analysis of leukocytes cell subpopulation in blood

Analysis of blood leukocyte subpopulations by FACS. Blood were isolated from female C57BL/6 and B-hCXCR2 mice (n=3, 7-week-old). Flow cytometry analysis of the blood was performed to assess leukocyte subpopulations. A. Representative FACS plots. Single live cells were gated for the CD45+ population and used for further analysis as indicated here. B. Results of FACS analysis. Percent of T cells, B cells, NK cells, dendritic cells, granulocytes, monocytes and macrophages in homozygous B-hCXCR2 mice were similar to those in the C57BL/6 mice, demonstrating that CXCR2 humanized does not change the overall development, differentiation or distribution of these cell types in blood. Values are expressed as mean ± SEM.
Analysis of T cell subpopulation in blood

Analysis of blood T cell subpopulations by FACS. Blood were isolated from female C57BL/6 and B-hCXCR2 mice (n=3, 7-week-old). Flow cytometry analysis of the blood was performed to assess leukocyte subpopulations. A. Representative FACS plots. Single live CD45+ cells were gated for TCRβ+ T cell population and used for further analysis as indicated here. B. Results of FACS analysis. The percent of CD4+ T cells, CD8+ T cells and Tregs in homozygous B-hCXCR2 mice were similar to those in the C57BL/6 mice, demonstrating that introduction of hCXCR2 in place of its mouse counterpart does not change the overall development, differentiation or distribution of these T cell subtypes in blood. Values are expressed as mean ± SEM.
Efficacy Validation on IBD

B-hCXCR2 mice were provided drinking water containing DSS for 7 consecutive days, and body weight changes were recorded throughout and scored clinically. (Fig. A-C) The body weight changes of animals in each group. (Fig. D) DAI score (disease activity index) of animals in each group. Compared with the vehicle group (G1), the body weight in the model group (G2) was significantly decreased and the DAI score was significantly increased, which indicated that the disease severity in the model group was aggravated; On the contrary, the body weight and the DAI score were significantly improved in the treatment group (G3). The results demonstrated that the DSS-induced inflammatory bowel disease model in B-hCXCR2 mice can be established successfully, and anti-hCXCR2 antibody H3h9 (in house) relieved the clinical symptoms of IBD. Values are expressed as mean ± SEM.