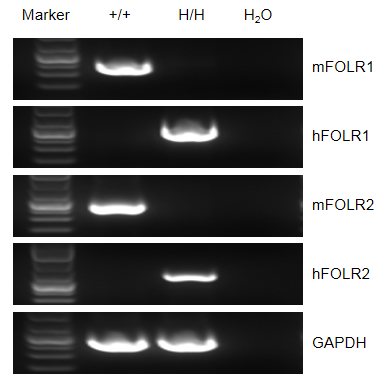
mRNA expression analysis
Strain specific FOLR1 and FOLR2 expression analysis in wild-type mice and homozygous B-hFOLR1/hFOLR2 mice by flow cytometry. Mouse Folr1 and Folr2 mRNA were detectable in splenocytes of wild-type (+/+) mice. Human FOLR1 and FOLR2 mRNA were detectable only in homozygous B-hFOLR1/hFOLR2 mice, but not in wild-type (+/+) mice.
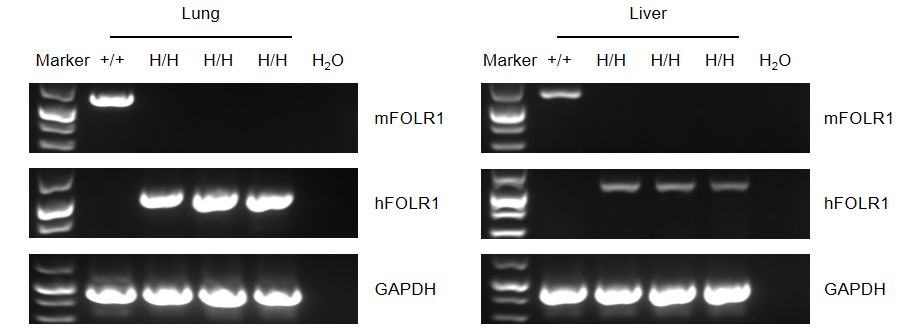
Strain specific FOLR1 expression analysis in wild-type mice and homozygous B-hFOLR1/hFOLR2 mice by flow cytometry. Mouse Folr1 mRNA was detectable in lung and liver of wild-type (+/+) mice. Human FOLR1 mRNA were only detectable in lung and liver of homozygous B-hFOLR1/hFOLR2 mice, but not in wild-type (+/+) mice.
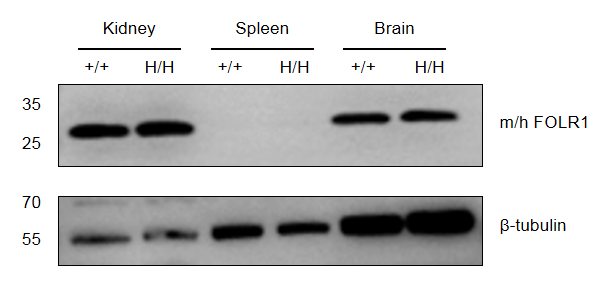
Protein expression analysis
Strain specific FOLR1 expression analysis in wild-type mice and homozygous B-hFOLR1/hFOLR2 mice by western blot. Kidney, spleen and brain were collected from C57BL/6 mice (+/+) and homozygous B-hFOLR1/hFOLR2 mice (H/H), and analyzed by western blot with anti-FOLR1 antibody. FOLR1 was detectable in kidney and brain but not spleen from wild-type mice and homozygous B-hFOLR1/hFOLR2 mice, as the antibody is crossly reactive with human and mouse FOLR1.
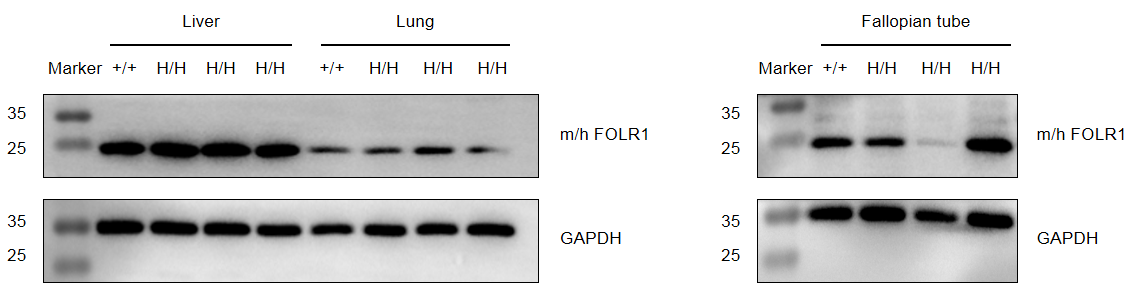
Strain specific FOLR1 expression analysis in wild-type mice and homozygous B-hFOLR1/hFOLR2 mice by western blot. Liver, lung and fallopian tube were collected from C57BL/6 mice (+/+) and homozygous B-hFOLR1/hFOLR2 mice (H/H), and analyzed by western blot with anti-FOLR1 antibody. FOLR1 was detectable in liver, lung and fallopian tube from wild-type mice and homozygous B-hFOLR1/hFOLR2 mice, as the antibody is crossly reactive with human and mouse FOLR1.
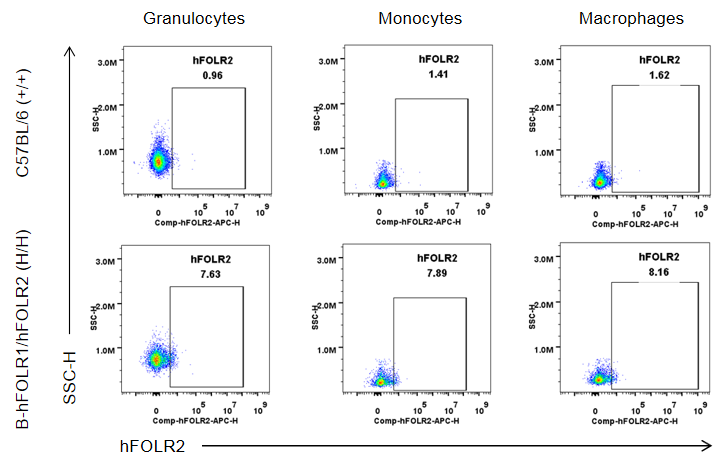
Strain specific FOLR2 expression analysis in wild-type mice and homozygous B-hFOLR1/hFOLR2 mice by flow cytometry. Blood was collected from C57BL/6 mice (+/+) and homozygous B-hFOLR1/hFOLR2 mice (H/H), and analyzed by flow cytometry with anti-FOLR2 antibody. hFOLR2 was only detectable in granulocytes, monocytes and macrophages of homozygous B-hFOLR1/hFOLR2 mice but not in wild-type mice.
Protein expression analysis in Bone marrow
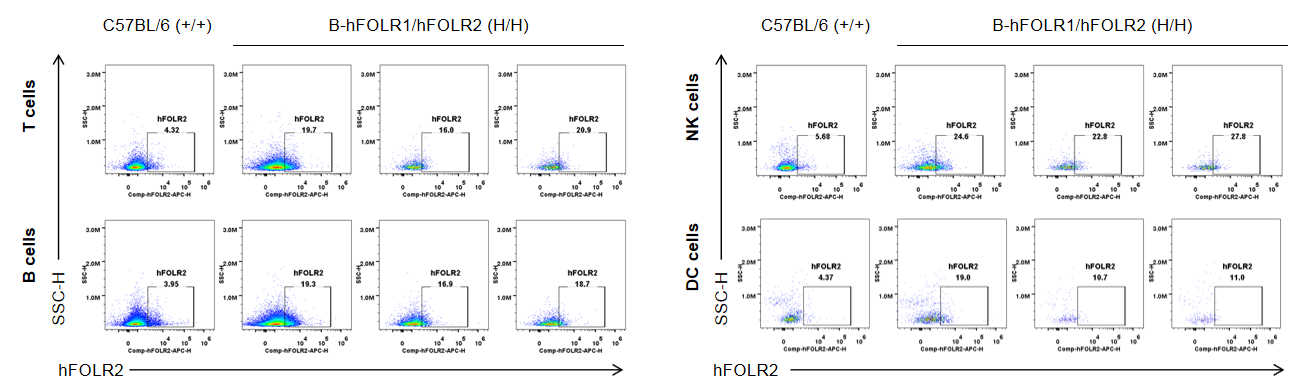
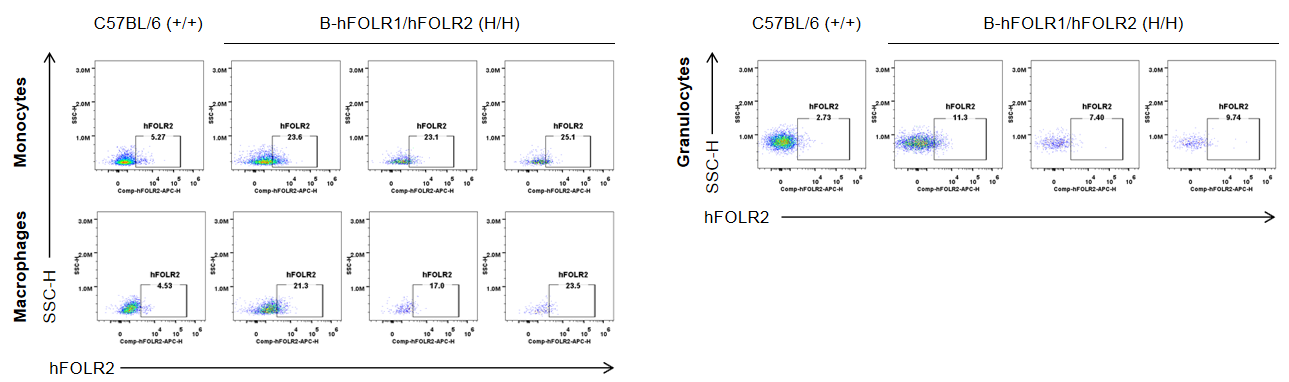
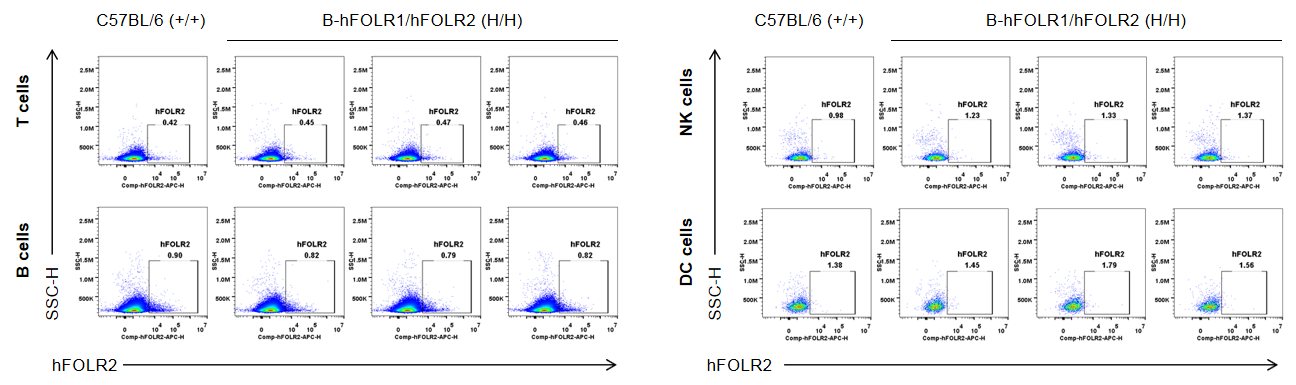
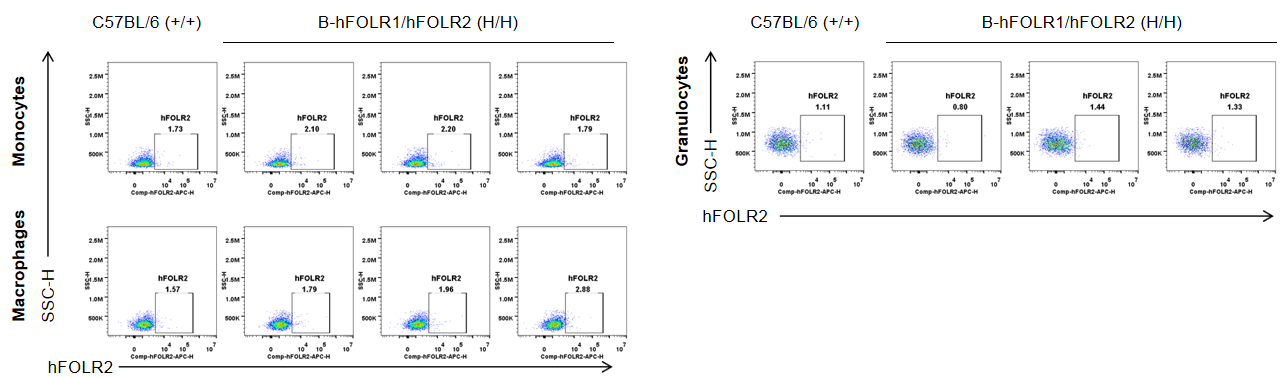
Strain specific FOLR2 expression analysis in wild-type mice and homozygous B-hFOLR1/hFOLR2 mice by flow cytometry. Bone marrow was collected from C57BL/6 mice (+/+) and homozygous B-hFOLR1/hFOLR2 mice (H/H), and analyzed by flow cytometry with anti-FOLR2 antibody. hFOLR2 was only detectable in T, B, NK and DC of homozygous B-hFOLR1/hFOLR2 mice but not in wild-type mice.Strain specific FOLR2 expression analysis in wild-type mice and homozygous B-hFOLR1/hFOLR2 mice by flow cytometry. Bone marrow was collected from C57BL/6 mice (+/+) and homozygous B-hFOLR1/hFOLR2 mice (H/H), and analyzed by flow cytometry with anti-FOLR2 antibody. hFOLR2 was only detectable in monocytes, macrophages and granulocytes of homozygous B-hFOLR1/hFOLR2 mice but not in wild-type mice.
Strain specific FOLR2 expression analysis in wild-type mice and homozygous B-hFOLR1/hFOLR2 mice by flow cytometry. Bone marrow was collected from C57BL/6 mice (+/+) and homozygous B-hFOLR1/hFOLR2 mice (H/H), and analyzed by flow cytometry with anti-FOLR2 antibody. hFOLR2 was only detectable in monocytes, macrophages and granulocytes of homozygous B-hFOLR1/hFOLR2 mice but not in wild-type mice.
Protein expression analysis in Blood
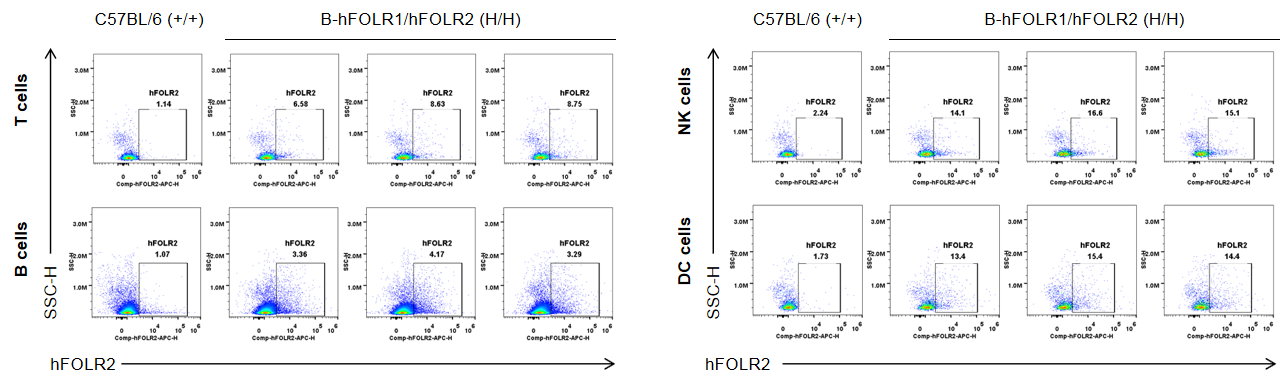
Strain specific FOLR2 expression analysis in wild-type mice and homozygous B-hFOLR1/hFOLR2 mice by flow cytometry. Blood cells were collected from C57BL/6 mice (+/+) and homozygous B-hFOLR1/hFOLR2 mice (H/H), and analyzed by flow cytometry with anti-FOLR2 antibody. hFOLR2 was only detectable in T, B, NK and DC of homozygous B-hFOLR1/hFOLR2 mice but not in wild-type mice.
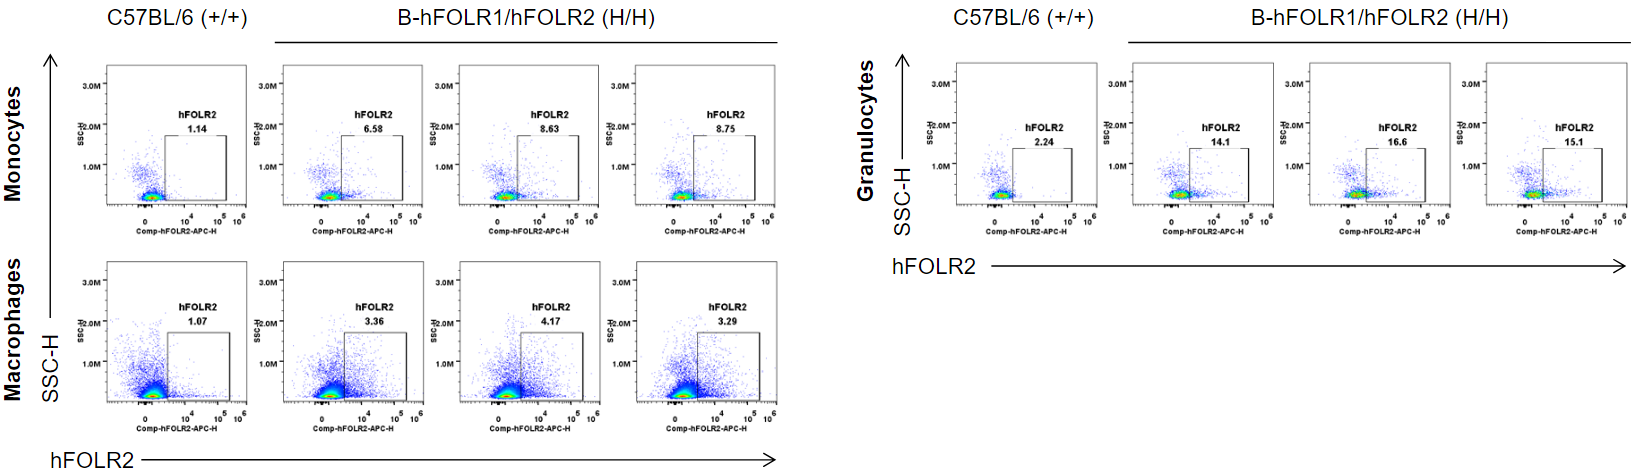
Strain specific FOLR2 expression analysis in wild-type mice and homozygous B-hFOLR1/hFOLR2 mice by flow cytometry. Blood cells were collected from C57BL/6 mice (+/+) and homozygous B-hFOLR1/hFOLR2 mice (H/H), and analyzed by flow cytometry with anti-FOLR2 antibody. hFOLR2 was only detectable in monocytes, macrophages and granulocytes of homozygous B-hFOLR1/hFOLR2 mice but not in wild-type mice.
Protein expression analysis in Spleen
Strain specific FOLR2 expression analysis in wild-type mice and homozygous B-hFOLR1/hFOLR2 mice by flow cytometry. Spleen was collected from C57BL/6 mice (+/+) and homozygous B-hFOLR1/hFOLR2 mice (H/H), and analyzed by flow cytometry with anti-FOLR2 antibody. hFOLR2 was not detectable in T, B, NK and DC of homozygous B-hFOLR1/hFOLR2 mice.
Strain specific FOLR2 expression analysis in wild-type mice and homozygous B-hFOLR1/hFOLR2 mice by flow cytometry. Spleen was collected from C57BL/6 mice (+/+) and homozygous B-hFOLR1/hFOLR2 mice (H/H), and analyzed by flow cytometry with anti-FOLR2 antibody. hFOLR2 was not detectable in monocytes, macrophages and granulocytes of homozygous B-hFOLR1/hFOLR2 mice.
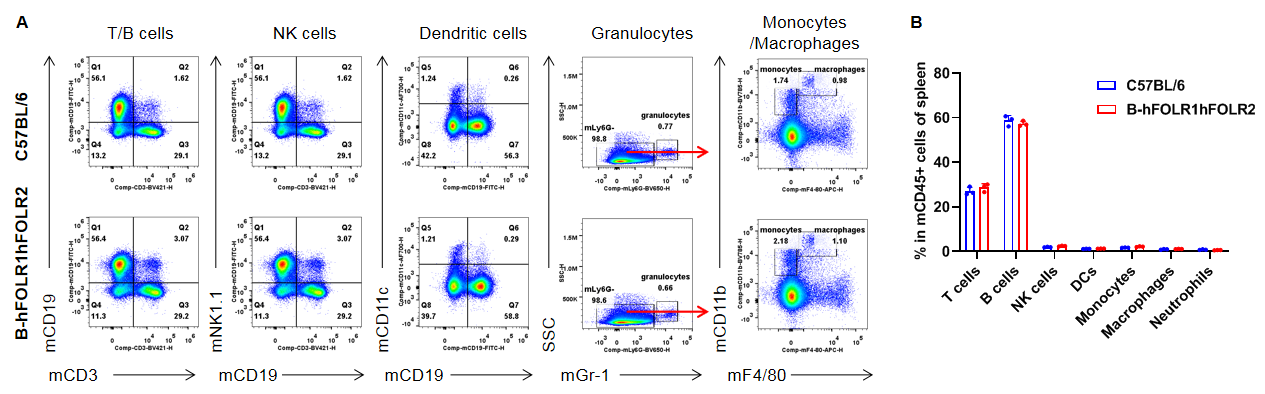
Analysis of leukocytes cell subpopulation in spleen
Analysis of spleen leukocyte subpopulations by FACS. Splenocytes were isolated from female C57BL/6 and homozygous B-hFOLR1/hFOLR2 mice (n=3, 8-week-old). Flow cytometry analysis of the splenocytes was performed to assess leukocyte subpopulations. A. Representative FACS plots. Single live cells were gated for the CD45+ population and used for further analysis as indicated here. B. Results of FACS analysis. Percent of T cells, B cells, NK cells, dendritic cells, granulocytes, monocytes and macrophages in homozygous B-hFOLR1/hFOLR2 mice were similar to those in the C57BL/6 mice, demonstrating that introduction of hFOLR1/hFOLR2 in place of its mouse counterpart does not change the overall development, differentiation or distribution of these cell types in spleen. Values are expressed as mean ± SEM.
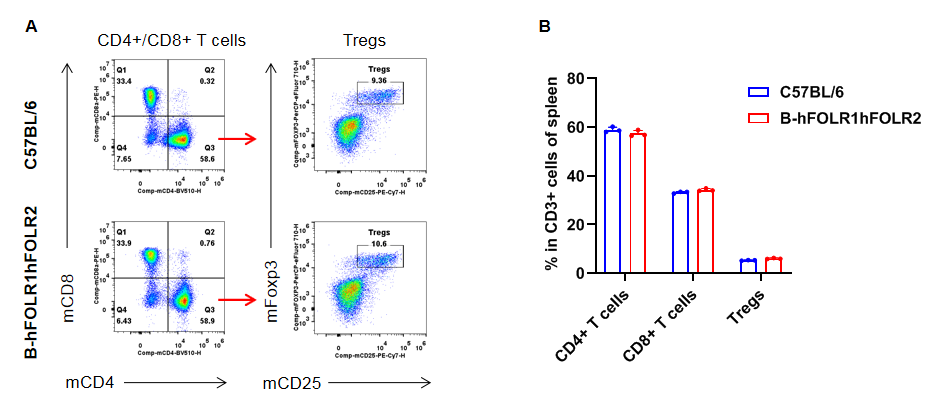
Analysis of T cell subpopulation in spleen
Analysis of spleen T cell subpopulations by FACS. Splenocytes were isolated from female C57BL/6 and homozygous B-hFOLR1/hFOLR2 mice (n=3, 8-week-old). Flow cytometry analysis of the splenocytes was performed to assess leukocyte subpopulations. A. Representative FACS plots. Single live CD45+ cells were gated for CD3+ T cell population and used for further analysis as indicated here. B. Results of FACS analysis. The percent of CD8+ T cells, CD4+ T cells, and Tregs in homozygous B-hFOLR1/hFOLR2 mice were similar to those in the C57BL/6 mice, demonstrating that introduction of hFOLR1/hFOLR2 in place of its mouse counterpart does not change the overall development, differentiation or distribution of these T cell subtypes in spleen. Values are expressed as mean ± SEM.
Analysis of leukocytes cell subpopulation in lymph node
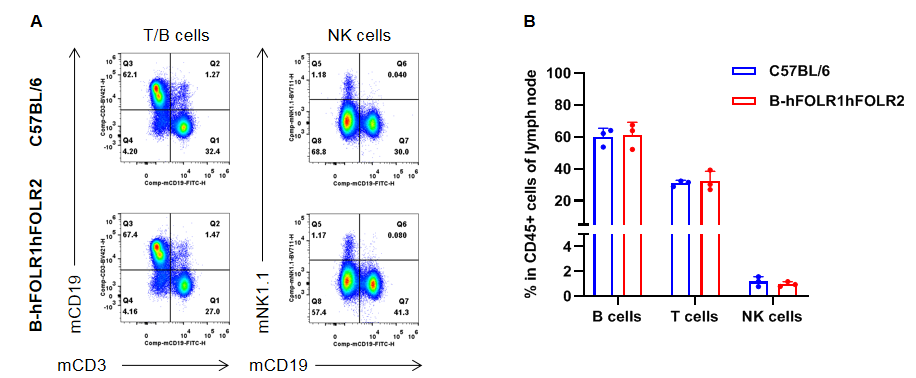
Analysis of lymph node leukocyte subpopulations by FACS. Lymph nodes were isolated from female C57BL/6 and homozygous B-hFOLR1/hFOLR2 mice (n=3, 8-week-old). Flow cytometry analysis of the leukocytes was performed to assess leukocyte subpopulations. A. Representative FACS plots. Single live cells were gated for CD45+ population and used for further analysis as indicated here. B. Results of FACS analysis. The percent of T cells, B cells and NK cells in homozygous B-hFOLR1/hFOLR2 mice were similar to those in the C57BL/6 mice, demonstrating that introduction of hFOLR1/hFOLR2 in place of its mouse counterpart does not change the overall development, differentiation or distribution of these cell types in lymph node. Values are expressed as mean ± SEM.
Analysis of T cell subpopulation in lymph node
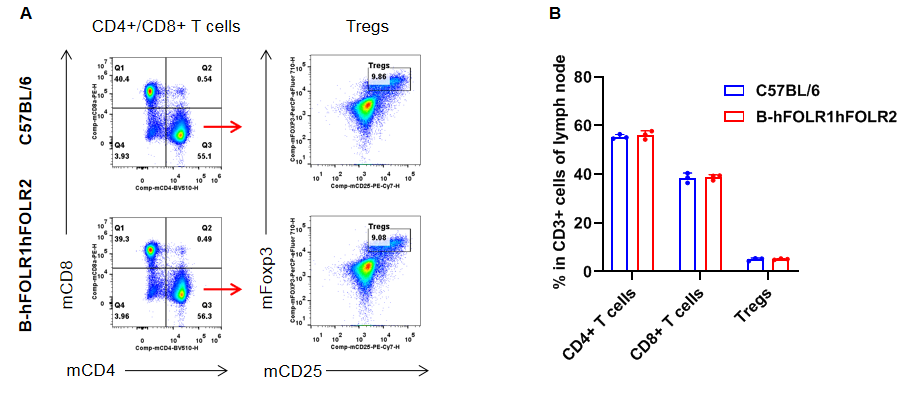
Analysis of lymph node T cell subpopulations by FACS. Lymph nodes were isolated from female C57BL/6 and homozygous B-hFOLR1/hFOLR2 mice (n=3, 8-week-old). Flow cytometry analysis of the splenocytes was performed to assess leukocyte subpopulations. A. Representative FACS plots. Single live cells were gated for the CD45+ population and used for further analysis as indicated here. B. Results of FACS analysis. The percent of CD8+ T cells, CD4+ T cells, and Tregs in homozygous B-hFOLR1/hFOLR2 mice were similar to those in the C57BL/6 mice, demonstrating that introduction of hFOLR1/hFOLR2 in place of its mouse counterpart does not change the overall development, differentiation or distribution of these T cell subtypes in lymph node. Values are expressed as mean ± SEM.
Analysis of leukocytes cell subpopulation in blood
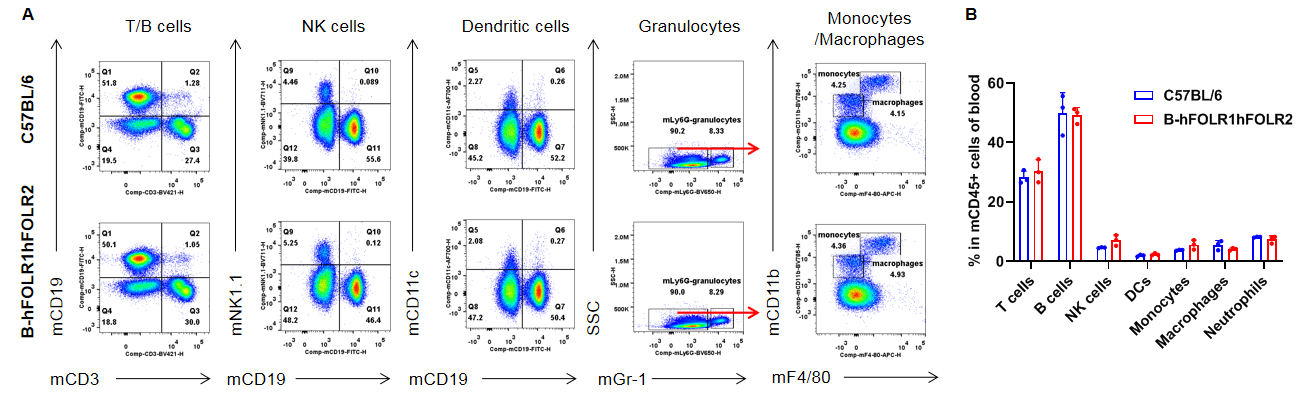
Analysis of blood leukocyte subpopulations by FACS. Blood were isolated from female C57BL/6 and homozygous B-hFOLR1/hFOLR2 mice (n=3, 8-week-old). Flow cytometry analysis of the splenocytes was performed to assess leukocyte subpopulations. A. Representative FACS plots. Single live cells were gated for the CD45+ population and used for further analysis as indicated here. B. Results of FACS analysis. Percent of T cells, B cells, NK cells, dendritic cells, granulocytes, monocytes and macrophages in homozygous B-hFOLR1/hFOLR2 mice were similar to those in the C57BL/6 mice, demonstrating that introduction of hFOLR1/hFOLR2 in place of its mouse counterpart does not change the overall development, differentiation or distribution of these cell types in blood. Values are expressed as mean ± SEM.
Analysis of T cell subpopulation in blood
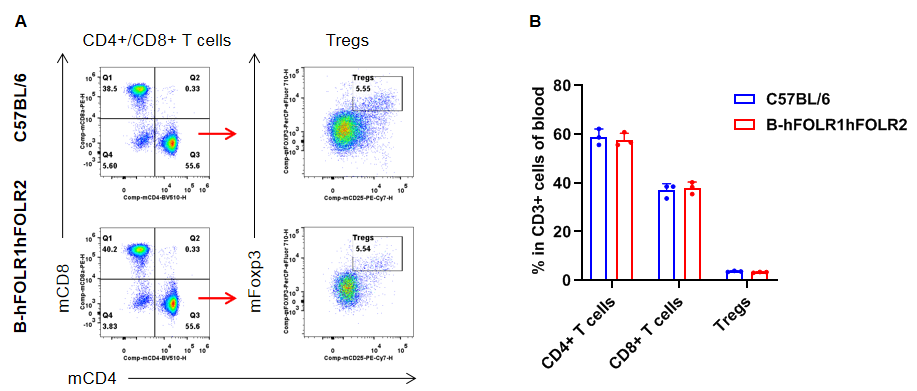
Analysis of blood T cell subpopulations by FACS. Blood were isolated from female C57BL/6 and homozygous B-hFOLR1/hFOLR2 mice (n=3, 8-week-old). Flow cytometry analysis of the splenocytes was performed to assess leukocyte subpopulations. A. Representative FACS plots. Single live CD45+ cells were gated for CD3+ T cell population and used for further analysis as indicated here. B. Results of FACS analysis. The percent of CD8+ T cells, CD4+ T cells, and Tregs in homozygous B-hFOLR1/hFOLR2 mice were similar to those in the C57BL/6 mice, demonstrating that introduction of hFOLR1/hFOLR2 in place of its mouse counterpart does not change the overall development, differentiation or distribution of these T cell subtypes in blood. Values are expressed as mean ± SEM.
* When publishing results obtained using this animal model, please acknowledge the source as follows: The animal model [B-hFOLR1/hFOLR2 mice] (Cat# 111065) was purchased from Biocytogen.